
Optimal Equilibrium With Positive Externalities
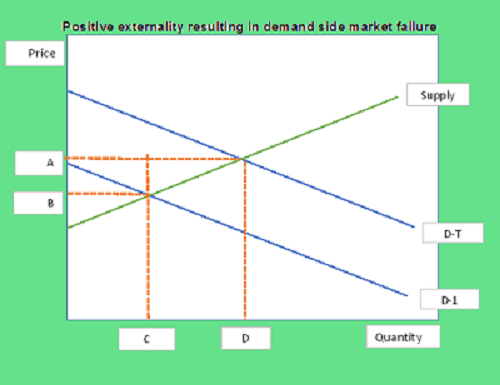
In the provided graph, D-1 represents the private demand curve and D-T represents the social demand curve that includes a positive externality. Which point indicates the socially optimal equilibrium?
A
The optimal equilibrium occurs on the supply curve at points A and B.
B
The optimal equilibrium occurs on the supply curve at points A and D.
C
The optimal equilibrium occurs on the supply curve at points B and C.
D
The optimal equilibrium occurs at price point B.